Op zoek naar verse producten van het land? Ik heb een kaart gemaakt waarop de boerderijwinkels in de regio Eindhoven zichtbaar zijn. Met name ten weste en zuiden van Eindhoven.
Bron: http://www.bijteun.nl , http://www.krentjesuitdepap.nl en google.nl
Monday, June 5, 2017

Sunday, May 28, 2017
Ontwikkelingen in de hypotheekmarkt
In deze post toon ik enkele analyse mogelijkheden mbt de hypotheek markt.
In februari heb ik de rente standen van http://www.actuelerentestanden.nl/pages/rente/hypotheekrente-overzicht/1-jaar-rente-vast.asp opgeslagen. Dit heb ik in mei weer gedaan.
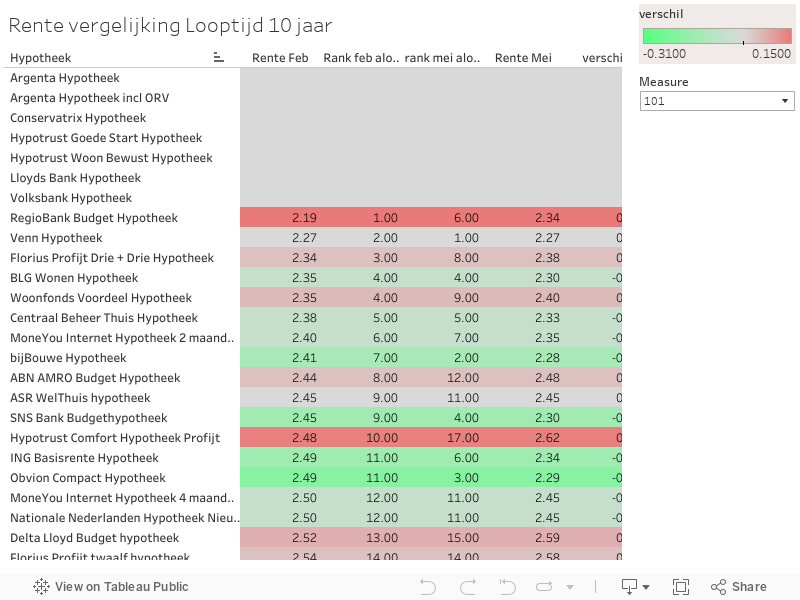
Dit maakt het mogelijk om veranderingen in kaart te brengen. Het onderstaande dashboard laat dit zien voor de rentes met een looptijd van 10 jaar. De hypotheken hebben een ranking gekregen zodat je de positie verschuiving van februari naar mei in kaart kunt brengen.
De parameter rechts stelt je in staat het financieringspercentage te kiezen.
 Het bovenstaande overzicht is echter beperkt tot een looptijd van 10 jaar. In het onderstaande overzicht zie je voor alle looptijden de ranking in febuari.
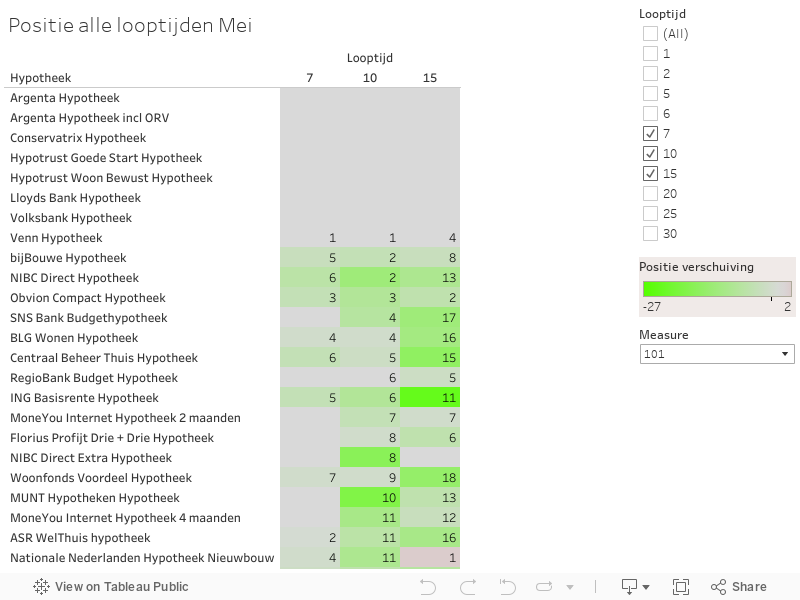
Hieronder zie je het overzicht van de ranking in mei.
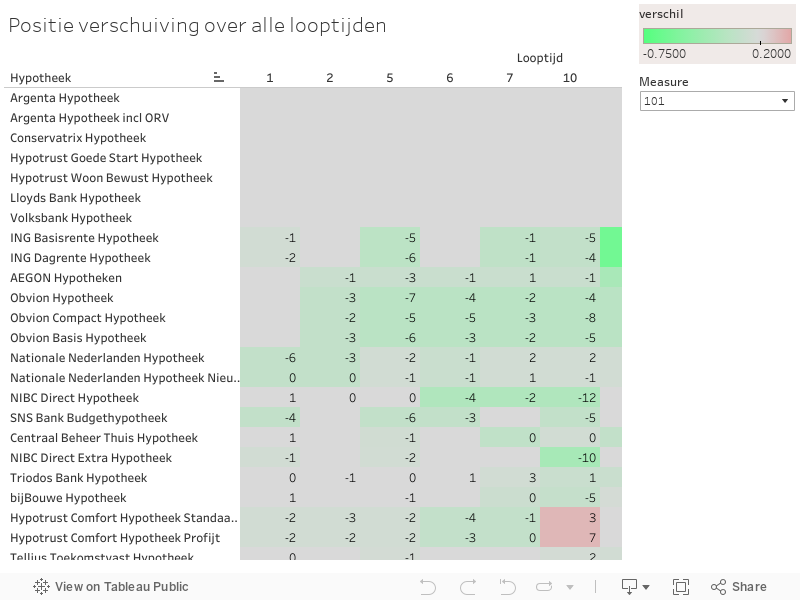
Vervolgens kan je de positieverschuiving analyseren. Welke observaties maak jij? Je reactie in het commentaar gedeelte wordt op prijs gesteld!
Nieuw:
Selecteer de looptijden naar wens en de hypotheken met de meest gunstige rente verschijnen bovenaan!!
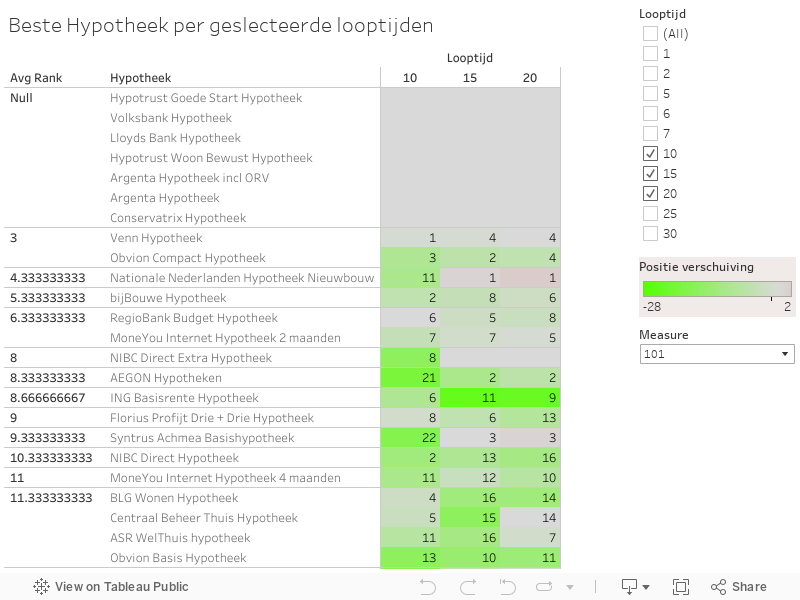
In februari heb ik de rente standen van http://www.actuelerentestanden.nl/pages/rente/hypotheekrente-overzicht/1-jaar-rente-vast.asp opgeslagen. Dit heb ik in mei weer gedaan.
Dit maakt het mogelijk om veranderingen in kaart te brengen. Het onderstaande dashboard laat dit zien voor de rentes met een looptijd van 10 jaar. De hypotheken hebben een ranking gekregen zodat je de positie verschuiving van februari naar mei in kaart kunt brengen.
De parameter rechts stelt je in staat het financieringspercentage te kiezen.
Nieuw:
Selecteer de looptijden naar wens en de hypotheken met de meest gunstige rente verschijnen bovenaan!!
Friday, May 26, 2017
Netto Maandlasten berekenen
Deze post is in het Nederlands omdat deze betrekkening heeft op de Nederlandse regelgeving.
Met dit dashboard kun je je Netto maandlasten (over de tijd) berekenen. Dit begint bij de totale kosten (1), om vervolgens te bepalen wat het financieringsbedrag bedraagt (2), ten slotte worden de netto maandlasten berekend o.b.v. de rente (3).
Ter info: standaard staan alle sliders op dit dashboard op de minimale waarde. De netto maandlasten geven dus niet de persoonlijke situatie van iemand weer.
1. Totale kosten
De totale kosten worden berekend als de som van:
A: Kavelprijs.
B: Totale M3 prijs.
Vanzelfsprekend kun je voor een bestaande woning A en B zo zetten dat het totaal correspondeert met het aankoopbedrag.
2. Financieringsbedrag.
Deze wordt bepaald door:
Totale kosten minus
a. Spaarsaldo
b. Verkoopwaarde huidige huis - resthypotheek.
Financieringsbedrag + overdrachtsbelasting (2%) + extra kosten
3. Netto Maandlasten.
Het bepalen van de netto maandlasten hang af van:
a. Verdeling aflossingsvrij, bankspaar en annuiteit.
b. Rentes.
3a.
Ik ga uit van een bestaande hypotheek met een deel aflossingsvrij en een deel bankspaar. Ik neem aan dat je deze wil meenemen naar de nieuwe lening om nog van de oude regeling gebruik te kunnen maken: hypotheekrente aftrek van bijv. 52% gedurende de resterende periode van de lening.
Je kunt met de sliders het totale leningsbedrag voor zowel aflossingsvrij als banksparen instellen. Te financieren minus deze twee bedragen geeft het annuiteitsbedrag. Deze is in de komende jaren beperkt aftrekbaar.
https://www.belastingdienst.nl/wps/wcm/connect/bldcontentnl/belastingdienst/prive/woning/uw_hypotheek_of_lening/tariefsaanpassing_aftrek_kosten_eigen_woning/tariefsaanpassing_aftrek_kosten_eigen_woning
Voor het annuiteitsdeel worden de netto bedragen volgens deze regeling bepaald.
3b.
Je kunt per rente deel de rente instellen. De rente die je kunt krijgen is afhankelijk van het financieringspercentage. Deze is boven weergegeven.
Zie ik iets over het hoofd? Kan je deze post waarderen? Schroom niet om feedback achter te laten op deze post of de linkedin share. Bedankt!
p.s. Je kunt het dashboard op volledige schermweergave zetten, rechts onder. De waarden instellen en vervolgens een pdf van je situatie downloaden.
Met dit dashboard kun je je Netto maandlasten (over de tijd) berekenen. Dit begint bij de totale kosten (1), om vervolgens te bepalen wat het financieringsbedrag bedraagt (2), ten slotte worden de netto maandlasten berekend o.b.v. de rente (3).
Ter info: standaard staan alle sliders op dit dashboard op de minimale waarde. De netto maandlasten geven dus niet de persoonlijke situatie van iemand weer.
1. Totale kosten
De totale kosten worden berekend als de som van:
A: Kavelprijs.
B: Totale M3 prijs.
Vanzelfsprekend kun je voor een bestaande woning A en B zo zetten dat het totaal correspondeert met het aankoopbedrag.
2. Financieringsbedrag.
Deze wordt bepaald door:
Totale kosten minus
a. Spaarsaldo
b. Verkoopwaarde huidige huis - resthypotheek.
Financieringsbedrag + overdrachtsbelasting (2%) + extra kosten
3. Netto Maandlasten.
Het bepalen van de netto maandlasten hang af van:
a. Verdeling aflossingsvrij, bankspaar en annuiteit.
b. Rentes.
3a.
Ik ga uit van een bestaande hypotheek met een deel aflossingsvrij en een deel bankspaar. Ik neem aan dat je deze wil meenemen naar de nieuwe lening om nog van de oude regeling gebruik te kunnen maken: hypotheekrente aftrek van bijv. 52% gedurende de resterende periode van de lening.
Je kunt met de sliders het totale leningsbedrag voor zowel aflossingsvrij als banksparen instellen. Te financieren minus deze twee bedragen geeft het annuiteitsbedrag. Deze is in de komende jaren beperkt aftrekbaar.
https://www.belastingdienst.nl/wps/wcm/connect/bldcontentnl/belastingdienst/prive/woning/uw_hypotheek_of_lening/tariefsaanpassing_aftrek_kosten_eigen_woning/tariefsaanpassing_aftrek_kosten_eigen_woning
Voor het annuiteitsdeel worden de netto bedragen volgens deze regeling bepaald.
3b.
Je kunt per rente deel de rente instellen. De rente die je kunt krijgen is afhankelijk van het financieringspercentage. Deze is boven weergegeven.
Zie ik iets over het hoofd? Kan je deze post waarderen? Schroom niet om feedback achter te laten op deze post of de linkedin share. Bedankt!
p.s. Je kunt het dashboard op volledige schermweergave zetten, rechts onder. De waarden instellen en vervolgens een pdf van je situatie downloaden.
Sunday, May 7, 2017
Analyze mortgage rates in Netherlands (March 2017)
In this post I would like to share the dashboard I created to Analyze the Analyze mortgage rates in Netherlands (March 2017). I built the dashboard very quickly. Drop a comment to get a copy so you can improve it yourself.
I tried Qlik Sense Qloud, but it turns out you need the enterprise license to embed the dashboard. This is a quick video get an impression.
I tried Qlik Sense Qloud, but it turns out you need the enterprise license to embed the dashboard. This is a quick video get an impression.
Saturday, May 6, 2017
Parcel (Kavel) analysis for Eindhoven region -> Veldhoven -> Oerle Zuid
Hi,
In this post, I would like to share a dashboard which I created to analyze parcel pricing, parcel dimensions, and square meter prices.
The steps I did:
- parse data from http://www.kavelsveldhoven.nl/oerle-zuid
- Create a Synoptic map https://synoptic.design/
- Create the dashboard.
I hope this Dashboard is of use to you:

In this post, I would like to share a dashboard which I created to analyze parcel pricing, parcel dimensions, and square meter prices.
The steps I did:
- parse data from http://www.kavelsveldhoven.nl/oerle-zuid
- Create a Synoptic map https://synoptic.design/
- Create the dashboard.
I hope this Dashboard is of use to you:

Saturday, April 1, 2017
AWS, R, RStudio, Parallel processing
In this post I will share my experiences with using a spot AMI instance for heavy parallel processing of R scripts.
Fist we start a Rstudio AMI:

Start a spot instance:

Request:
 Search AMI:

Search for Rstudio:

select the needed compute power:

Its recommended to look at the pricing history:

In this case, we select a General Purpuse 16 CPU machine, which has a fair price per hour. Since we only use the machine for some heavy processing, we will decommission it in a few hours.

Leave the other settings as is.
select next, be sure to create a new key pair, in case you do not have the original key pair.
 Its also good to add a new security group which has port 80 open:

open the ports:

The click 'Launch' instance, and then click op the capacity link;
 Look up the public IP:
 You should now be able to log on:
 Log on credentials can be found here:
http://www.louisaslett.com/RStudio_AMI/
Now that the server is up and running we can start using R packages to allow parallel processing:
We use the package
In order to initialize we;
- set the number of cores.
- initialize a cluster
-and we need to export our functions, variables and datasets to the clusters:
There are a number of options for parralel processing roughly speaking you can choose from ParLapply and forEach. When you would like to split your dataset in multiple subsets and want to have a worker node perform an operation this can easily be done with a forEach, see example below. In both cases a list is returned. While we usualy would like to have a full dataset in return. In order to achieve this result I used the code do.call("rbind", result).
Many more examples can be found on: http://gforge.se/2015/02/how-to-go-parallel-in-r-basics-tips/
Fist we start a Rstudio AMI:
Start a spot instance:
Request:
Search for Rstudio:
select the needed compute power:
Its recommended to look at the pricing history:
In this case, we select a General Purpuse 16 CPU machine, which has a fair price per hour. Since we only use the machine for some heavy processing, we will decommission it in a few hours.
Leave the other settings as is.
select next, be sure to create a new key pair, in case you do not have the original key pair.
open the ports:
The click 'Launch' instance, and then click op the capacity link;
http://www.louisaslett.com/RStudio_AMI/
Now that the server is up and running we can start using R packages to allow parallel processing:
install.packages("doParallel",dependencies=TRUE)
install.packages("doMC",dependencies=TRUE)
We use the package
library(doParallel)
library(foreach)
library(doMC)
In order to initialize we;
- set the number of cores.
- initialize a cluster
-and we need to export our functions, variables and datasets to the clusters:
#prep parralel processing
# Calculate the number of cores
no_cores <- detectCores() - 1
# Initiate cluster
cl <- makeCluster(no_cores)
registerDoMC(no_cores)
clusterExport(cl=cl, varlist=c("splitter", "create_ngram_table"))
There are a number of options for parralel processing roughly speaking you can choose from ParLapply and forEach. When you would like to split your dataset in multiple subsets and want to have a worker node perform an operation this can easily be done with a forEach, see example below. In both cases a list is returned. While we usualy would like to have a full dataset in return. In order to achieve this result I used the code do.call("rbind", result).
Many more examples can be found on: http://gforge.se/2015/02/how-to-go-parallel-in-r-basics-tips/
 result = foreach(j=seq(1,nl, by=(nl/parts))) %dopar% {
      }
    }
  }
  do.call("rbind", result)
}
Monday, March 27, 2017
Build your custom Geo solution for QlikView in 5 minutes
In this post I will show how to build a Geo plot without the need for GeoAnalytics or Indevio. It will be way more limited functionality wise, you will be able to plot your data on a map. The result will look like this:

First you need a map of which you need to know the lat and long coordinates of the square corners. For this navigate to:
https://www.darrinward.com/lat-long/?id=2778191
Enter a set of coordinates for the corners:


In QlikView add a new scatter chart:
 Add the lat and long dimensions:
 Specify the axis:
 Enter next untill this screen. Deselect 'forced 0' and enter the x and y axis ranges, by using the values you used on lat-long website:
 As background image to the chart load the screen capture of the lat-long website:
 Press finish and your result will look like this:

Obviously, you need to geo code your adress data. This can easily be done by most ETL tools.
Hope this is usefull.
First you need a map of which you need to know the lat and long coordinates of the square corners. For this navigate to:
https://www.darrinward.com/lat-long/?id=2778191
Enter a set of coordinates for the corners:
Take a screen capture starting and ending on the specified corners:
In QlikView add a new scatter chart:
Obviously, you need to geo code your adress data. This can easily be done by most ETL tools.
Hope this is usefull.
Subscribe to:
Posts (Atom)