Then boot the Pi, run the LX terminal and type in (using the keyboard): epiphany-browser localhost/weer.html (or whatever name you gave the html file).
btw; I still need to find a way to turn of the screen saver..
This summer I will post quite a bit about BIML. In this post I will share how one can develop BIML packages without purchasing additional software. I installed Microsoft Visual C# 2008 express edition, because it hardly occupies any disk space and is a free download. Within Visual C# is run this code:
using System; using System.Data; using System.Data.SqlClient; using System.Collections.Generic; using System.ComponentModel; using System.Text; using System.Diagnostics; using System.Windows.Forms;
public class ExtractTable { public string PackageName { get; set; } public string SequenceName { get; set; } public string DataFlowName { get; set; } public string SchemaName { get; set; } public string SourceSystemName { get; set; } public string SelectQuery { get; set; } public string SQLFlavour { get; set; } public string ExtractTableName { get; set; } public string SourceTableName { get; set; } public string ArchiveProcedure { get; set; }
using (SqlConnection conn = new SqlConnection(metadataConnectionString)) { using (SqlCommand cmd = new SqlCommand(query, conn)) { cmd.Parameters.AddWithValue(parameter, parameterValue); SqlDataAdapter adapter = new SqlDataAdapter(cmd);
foreach (ExtractTable extractTable in extractTables) { string text = System.IO.File.ReadAllText(@"C:\TFS\Temp\biml.txt"); text = text.Replace("<#=extractTable.PackageName#>", extractTable.PackageName); text = text.Replace("<#= extractTable.SelectQuery#>", extractTable.SelectQuery); Clipboard.SetText(text);
} }
}
The most important thing to note about this code is the fact a predefined piece of biml code is loaded from a text file and the variables are replaced by the values coming from the meta data repository in SQL. The resulting non dynamic biml code can then be pasted in VS2008 or later with BIDS helper to generate the package. Any error messages will be a lot easier to debug. Will be continued..
During the DWH and BI summit, I got inspired to look into Graph Databases. A former colleague recommended looking into Neo4J. It turned out to be quite easy to load data in Neo4J and more easily explore related data. In our case, we wanted to analyze our Meta Data Driven DWH Framework. Which had grown quite a bit and became more and more difficult to maintain. We gave the 'Force directed Graph' visualization in Power BI a try, but this was to limited for our analysis goals.
I this post I will show how to build a remote controlled car with your Raspberry Pi that will stop whenever it encounters a wall at a predefined distance. The result will look like this:
Wiring was done as described on the internet. The car is remote controlled via telnet using Putty.
Code
The code below is executed. This was tricky because the key listener needs to be non blocking. Once I found one that is non blocking. Its just a matter of using keys, I, J, K, L for steering the car. The distance sensor checks for distances less than 30 CM. The motor is turned off when this happens.
import sys import select import tty import termios import contextlib import time import RPi.GPIO as GPIO GPIO.setmode(GPIO.BCM)
#used by the piborg # Set which GPIO pins the drive outputs are connected to DRIVE_1 = 4 DRIVE_2 = 18 DRIVE_3 = 8 DRIVE_4 = 7
# Set all of the drive pins as output pins GPIO.setup(DRIVE_1, GPIO.OUT) GPIO.setup(DRIVE_2, GPIO.OUT) GPIO.setup(DRIVE_3, GPIO.OUT) GPIO.setup(DRIVE_4, GPIO.OUT)
# Map current on/off state to command state dInvert = {} dInvert[True] = GPIO.LOW dInvert[False] = GPIO.HIGH
# Map the on/off state to nicer names for display dName = {} dName[True] = 'ON ' dName[False] = 'OFF'
# Function to set all drives off def MotorOff(): GPIO.output(DRIVE_1, GPIO.LOW) GPIO.output(DRIVE_2, GPIO.LOW) GPIO.output(DRIVE_3, GPIO.LOW) GPIO.output(DRIVE_4, GPIO.LOW)
if isData(): c = sys.stdin.read(1) print str((c)) if c == '\x1b': # x1b is ESC break elif c == 'i': #Vooruit MotorOn() elif c == 'k': #Stop MotorOff() elif c == 'j': #Links print 'links' if ((GPIO.input(DRIVE_1)) & (GPIO.input(DRIVE_4))): print 'aan het rijden' GPIO.output(DRIVE_1, GPIO.LOW) GPIO.output(DRIVE_2, GPIO.LOW)
time.sleep(0.1) GPIO.output(DRIVE_1, GPIO.HIGH) GPIO.output(DRIVE_2, GPIO.HIGH) else: GPIO.output(DRIVE_3, dInvert[GPIO.input(DRIVE_3)]) GPIO.output(DRIVE_4, dInvert[GPIO.input(DRIVE_4)]) elif c == 'l': #Rechts print 'rechts' if ((GPIO.input(DRIVE_1)) & (GPIO.input(DRIVE_4))): print 'aan het rijden' GPIO.output(DRIVE_4, GPIO.LOW) GPIO.output(DRIVE_3, GPIO.LOW)
In this post I will show how to run an R script from Power BI which will execute an Association rule learning script to perform market basket analysis.
In this example we will not look at products sold, but products sharing shelf space.
The dataset
Our basic dataset looks like this.
Our products:
The distribution / presence of products on the shelf of a customer:
The Power BI building blocks
The data model
As for the DAX part we will start with this post of Marco Russo and Alberto Ferrari.
So the data model in Power BI looks like this:
The R visualization
We will look at the DAX part later on. First we add an R component with a script that will return the AR rules it found.
The table contains the basic output that is to be expected from AR. We will try to build these measures in DAX later on.
Unfortunately Power BI initializes a new R sessions each time the R visualization is run / cross filtered. Therefore I tried to use a much base R as possible. As for the libraries that need to be loaded. I put these in a separate folder on my local drive and specified the folder name in the library command.
Building it in DAX
Support
The output of the arules R script can be built in DAX whenever it concerns single item combinations, so X -> Y. So not A, B -> Y. The 'support' measure is basically the '[Orders with Both Products %]' described by Russo and Ferrari. Just to show how its implemented on our dataset.
Customers with Both Products % =
IF (
    NOT ( [SameProductSelection] );
    DIVIDE ( [Customers with Both Products]; [Unique Customers All] )
)
After watching this very nice episode of Tegenlicht about smart cities I got inspired to start sharing my experiences with my Raspberry Pi. I started playing with the Pi about 2 years ago and tried a most of the common sensors (temp, light, sound, movement, etc). The coming period I will start sharing my experiences. The is the Tegenlicht episode on smart cities, higly recommended!
By the end of this post we are able to view the temperature on a webpage which can be viewed with your computer or any mobile device of course.
Regarding the hardware purchase; I like to buy the Pi at SOS solutions because this guy makes sure the peripherals are high quality. You can get the Pi for a slightly lower price elsewere but he makes up with good service 7 days a week!
I buy all the componts at vanallesenmeer.nl. This shop offers the products at the lowest price possible and delivery has always been on time.
Software used:
- Putty for telnet session
- FileZilla to transfer the files with FTP
- Notepad++ to edit / write the code.
Putting it together:
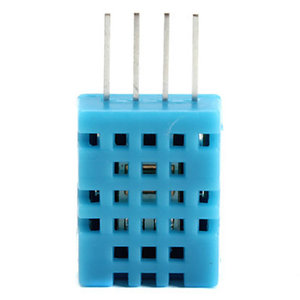
This shows how I wired the DHT11:
It looks like this in real life:
The software: We install the ADA fruit DHT library for convenience as instructed.
if humidity is not None and temperature is not None: print 'Temp={0:0.1f}*C Humidity={1:0.1f}%'.format(temperature, humidity) else: print 'Failed to get reading. Try again!'
When you place this file in the /var/www/ folder next to a php file with the following contents you will be able to disply the temperature on a webpage.
In this blogpost I show how to calculate the correlation in DAX. This post will be refined in the future, also to show the comparison with R. The code is shown so you see how to run it in DAX studio. We will investigate the correlation between visits and sales. We define the standard deviation for visits: